

Lessons from my investment journey – Ami Organics/Acutaas Chemicals

In February 2023, we invested in Ami Organics at a price of ₹878 (Market Cap: ₹3,200 crores). Our investment thesis, though extensive, boiled down to the following key points:

1. Promoter & Team: A technocratic promoter with strong scientific expertise, supported by a well-balanced team of youth and experience.

2. Strong Moats: A global leader, holding 30–90% global market share in complex pharma intermediates, with a solid track record. The company has been ahead of the curve, with a promising drug pipeline and potential opportunities driven by innovator-led New Chemical Entities (NCEs).
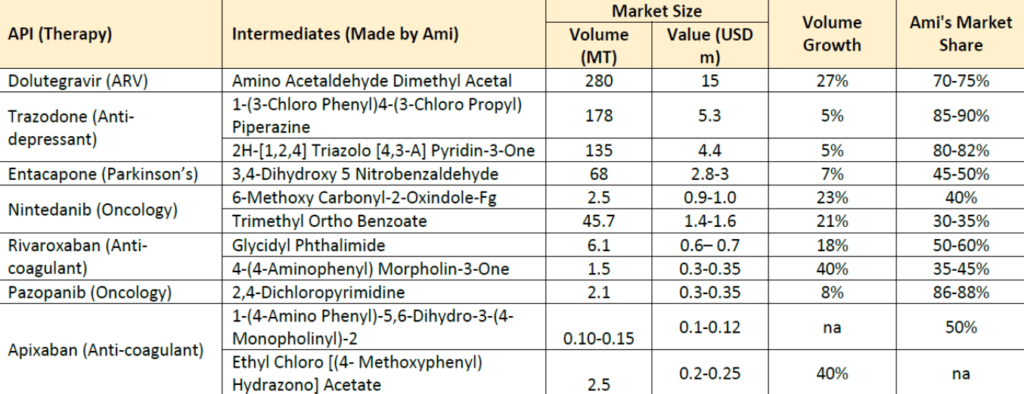
3. Forward-Looking Vision: Diversifying into the EV ancillary sector by venturing into electrolyte
production, alongside an entry into semiconductor chemicals (announced shortly after our entry)
through the acquisition of Baba Fine Chemicals.

4. Growth Visibility: Strong growth prospects for at least the next decade at a relatively non-expensive
valuation, making it a lower-risk investment from our entry point.

Beyond these factors our thesis anchored on the inflection point for Darolutamide – which is a breakthrough molecule in the prostate cancer space (innovated by Orion – Ami’s existing client for Entacapone). The molecule displayed hyper growth tendencies scaling from EUR 220 Mn to >460 Mn+ in 2022 – with guidance of >3Bn EUR by 2030. We anticipated this opportunity to be larger than Acutaas’s topline in FY23 (Rs 617 Cr).
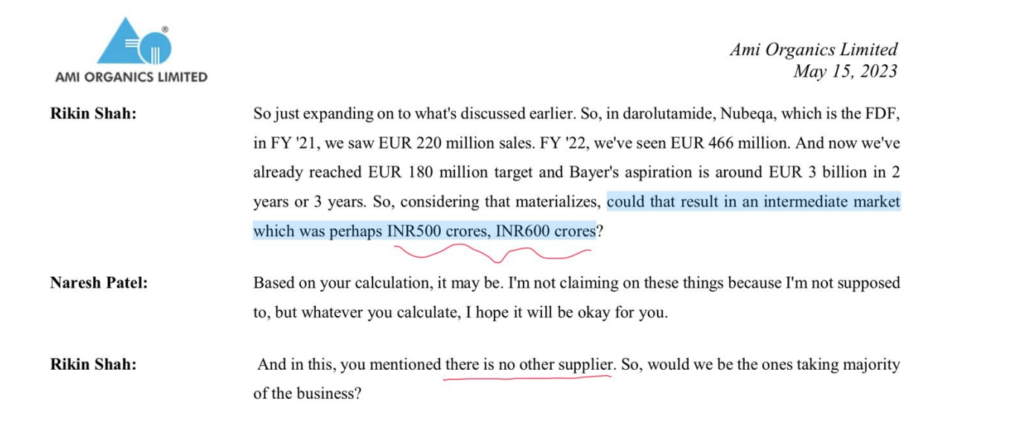
When we invested in the company, there was almost no neutral institutional coverage on the business – just plain noise that kept away good brokerages.

Challenges and Anti-Thesis Faced

Our investment in Ami Organics was far more contrarian than expected. Throughout the holding period, we encountered persistent skepticism from our team, clients, and the analyst community. Even marquee investors with ownership from the Pre-IPO round (anchor book) seemed to have lost confidence.
Some of the key counter arguments we faced were:

  • “The promoter is all talk”: There were concerns due to repeated missed guidance.
  • “The electrolyte opportunity is a sham”: Delays in this segment fueled doubts about its potential.
  • Post-Ǫ2 FY24 earnings: A significant dip in performance led to the belief that margins would not
    recover.
  • Bearish reports: One prominent sell-side analyst frequently released downgrade reports,
    forecasting doomsday scenarios (although they were entitled to their views).
    A downgrade by a particular SELL SIDE Analyst had the target price listed below Rs 700/share.
  • Valuations: Concerns that the Price-to-Earnings (P/E) ratio was unsustainable,
    questioning how returns could be generated.

The Road Ahead – Transformation to a multi segment giant
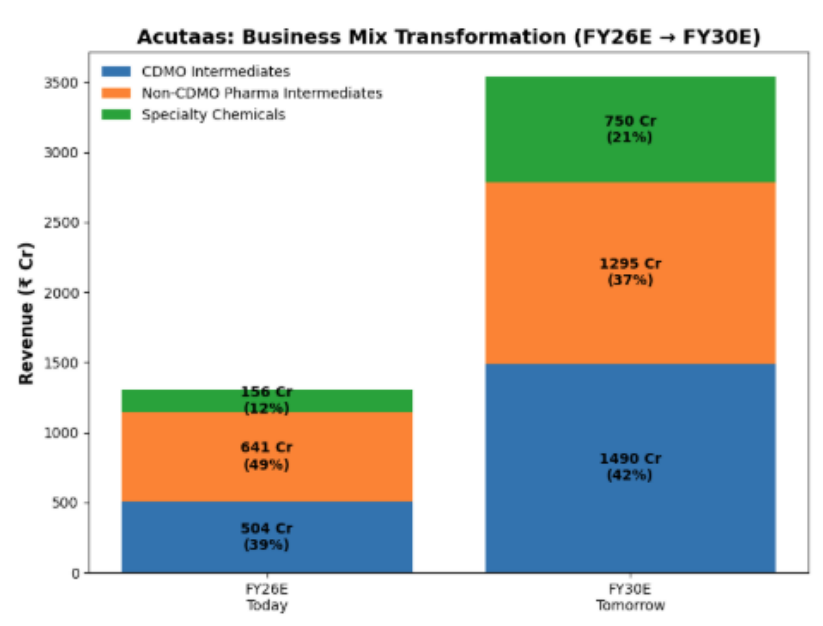
Acutaas’s transformation to a multi-segment giant is based on seeds sown over several years/decades.

Lessons Learned

Despite the skepticism and noise, the experience with Ami Organics provided valuable lessons:

  1. Prices Shape Narratives: Today, institutions such as HDFC, SBI
    and Marcellus are significant investors in the same business that was once criticized for having a promoter who was perceived as “ALL TALK.” Large brokerages have now initiated coverage (Kotak), and others have acknowledged vast opportunities in the electrolyte space
    (Spark/JM).
  2. Patience is Key: It’s challenging to watch other stocks soar while your position lags. But don’t let short-term price movements cloud your judgment. If your investment thesis holds true, your day will come.
  3. Market EǪ > IǪ: While buying a stock may be easy, sizing and scaling your position is much harder. The world will try to push you out of your position – if you let it. Ignore the noise and have the stomach to power through.
  4. Good News and Good Prices seldom coincide: When optionality’s seemed uncertain, and execution seemed weak, the stock price was also on the lower side.
  5. Avoid Being a P/E Investor: Don’t base your decisions solely on P/E ratios. A wise man once said on selling stocks based on valuations – “Don’t be lazy, be very lazy”.

While several stocks have performed even better for us over a similar timeframe, I take great pride in the journey with AMI.

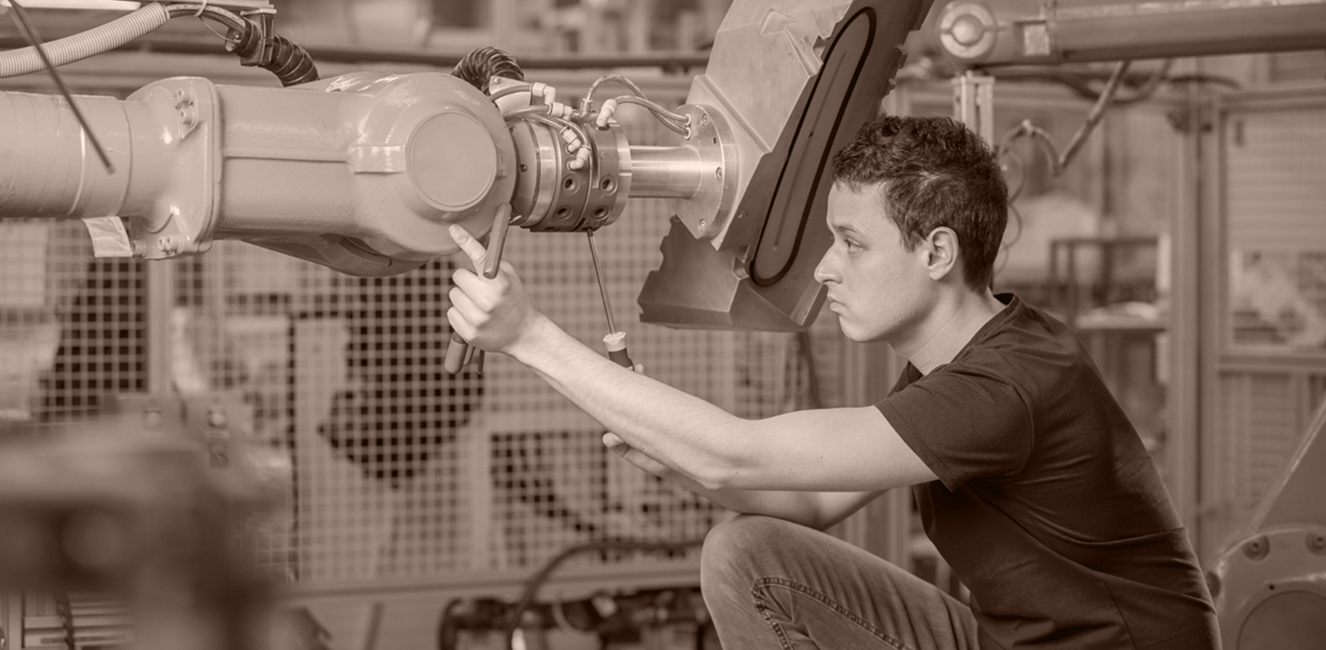
Learnings From Our Investment Journey and The Road Ahead: Sansera Engineering

Investing often feels like a game of identifying who is “changing the engine while the plane is still flying.” Our journey with Sansera Engineering has been exactly that—a masterclass in spotting a precision engineering giant hiding in the plain sight of a “traditional auto ancillary” label.

When we first initiated coverage (IC) in late 2022, the street was fixated on cyclic two-wheeler volumes and heavy reliance on ICE engines. We chose to look at the Flywheel of Competencies.

1. The “Street” Missed the Moat: An Engineering Powerhouse, Not a “traditional auto ancillary”

At the time of our IC, the market valued Sansera as a vendor of connecting rods and rocker arms. What they failed to factor in was Sansera’s integrated machine-building and Precision Engineering capabilities.

In-house CNC Machines: Sansera doesn’t buy machines; it builds them. To date, they have built over 975 CNC machines in-house.
The Cost & Agility Edge: These machines are 20–30% cheaper than imports and are highly modular. This allows them to switch production lines from automotive to aerospace with minimal downtime—a level of agility most peers lack.
Design Partners: They aren’t “built-to-print” vendors. They co-design components with OEMs right from the Statement of Requirements (SOR) stage, creating immense customer stickiness.

2. The EV “Tailwind” vs. the Market’s Perception of “Headwind”

The loudest bear case at the time was the “EV threat” to ICE components. Our deep dive revealed that Sansera was actually future-proofing its business:

Higher Kit Value: We recognized early that Sansera’s kit value for an Electric 2-wheeler is 10–20% higher than for an ICE scooter.
Sole Supplier Status: They secured sole supplier status for major players like Ola Electric for their first 5 million units.
Material Science Pivot: Their foray into Aluminium Forging was a strategic move to capitalize on the “light-weighting” trend essential for EVs.

3. The Data That Proves the Pivot: Order Book Evolution

The most compelling evidence of Sansera’s transformation isn’t just in the narrative—it’s in the hard numbers. The market missed the distinction between “Auto Order Book” (cyclical) and “ADS Backlog” (long-term visibility).

The “Then vs. Now” Snapshot

MetricAt Time of IC (FY22)Current (H1 FY26)The Pivot
Aerospace (ADS) RevenueRs. 60 Cr (3% of Sales)Rs. 86 Cr in H1FY26 itself (6% of H1 Sales)
ADS Target: Rs. 300–320 Cr for FY26e | Rs. 500–550 Cr in FY27e i.e. ~13% of Sales will be ADS in FY27
5× Growth in scale
ADS Order BacklogNegligibleRs. 3,953 Cr executable in 5 yearsThe “Hidden” Asset
Order BookRs. 1,100 CrRs. 2,146 Cr2× Growth in new business wins
Total Revenue VisibilityRs. 1,100 Cr (Annualized)Rs. 6,000+ Cr (Combined)Structural change in longevity

Critical Insight:
At the time of our IC, Aerospace was a minuscule 3% of revenue (~Rs. 60 Cr). Today, the unexecuted backlog for ADS alone is Rs. 3,953 Cr—executable over 5 years. This gives them revenue visibility that is totally uncorrelated to the auto cycle.

4. The “ADS” Explosion: From Niche to Core

While the Street worried about monthly auto sales numbers, we focused on the Aerospace, Defence, and Semiconductor (ADS) segment. This was the asymmetric upside the market ignored because of its small initial base.

Entry Barriers: ADS requires a decade of building trust. Sansera spent that decade qualifying for Boeing and Airbus supply chains.
Semiconductor Breakthrough: They have now broken into the semiconductor manufacturing supply chain, a market with even higher precision requirements and sticky margins.
Guidance: Management is now guiding for ADS revenue to touch Rs. 500–550 Cr by FY27, backed by the massive Rs. 3,953 Cr backlog.

The Financial Journey (Rs. Crores)
We saw the transformation in the numbers long before the valuation rerated

ParticularsFY20 (Actual)FY22 (At IC)FY25 (Actual)
Revenue1,4571,9893,017
EBITDA225334515
EBITDA %15.4%16.8%17.1%
PAT80132217
Net Debt/Equity0.5x0.6x(0.0x)

Note: As of H1FY26, the company is net-debt free, giving them a fortress balance sheet to fund the next leg of ADS expansion.

Current Snapshot (Jan 2026):
The stock has rerated from ~Rs. 700 at IC to ~Rs. 1,800 today, reflecting the market finally acknowledging its “Engineering DNA” rather than its “Auto DNA”.

Final Thought: The Art of Seeing

Our investment journey with Sansera Engineering reinforces that the biggest arbitrages aren’t in valuation, but in time horizon. Core learnings:

Arbitrage the Time Horizon: Market inefficiencies are often in time, not price.
Capability Trumps Category: A precision engineering platform—not just an auto component label.
Trust is a “J-Curve”: Aerospace credibility precedes revenue.
Terminal Value is King: Future supply-chain entrenchment drives conviction.

From a humble workshop in Bengaluru to a critical node in the global high-tech supply chain, Sansera Engineering shows that resilience and competence eventually translate into returns. From simple rods to critical aircraft gimbals—Sansera has truly “spread its wings”.

The Road Ahead: Foundation Built, Credibility Established and Now the Flywheel Starts Spinning…

If the last few years were about planting seeds in high-tech soil, the next phase is about harvest. Sansera is at an inflection point where its portfolio of competencies compounds non-linearly.

1. The ADS Explosion: From Validation to Scale

The Aerospace, Defence, and Semiconductor (ADS) segment is no longer an experiment; it is the company’s new growth engine

• From ~Rs. 125 Cr sales in FY25 → Rs. 300–320 Cr in FY26 → Rs. 500–550 Cr in FY27.
• Medium-term aspiration: Rs. 800–1,000 Cr in 3–5 years.
• Backed by confirmed order books; ADS backlog ≈ 25% of total new business.
• Recent Rs. 160 Cr per annum Tier-1 Airbus order for the Airborne Intensive Care Transport Module signals value-chain upgrade.

2. The Semiconductor Frontier

Sansera has successfully leaped from microns to nanometers.

• Won a $12 Million order (LOI scaling to $30 Million annually) from a global semiconductor fab equipment manufacturer.
• Requires extreme precision (Class 1000 clean rooms) and delivers sticky, high-margin revenue.
• Creates a massive competitive moat versus traditional auto peers.

3. Global “Plus One” Beneficiary

While Europe faces headwinds from high energy costs and skilled labor shortages, Sansera is perfectly
positioned to capture the “China+1” and “Europe+1” shift.

• Positioned for China+1 and Europe+1 outsourcing shifts.
• Estimated international revenue CAGR: >20%.
• 20–30% CNC cost advantage strengthens competitiveness.

Our Vision: The Best Is Yet to Come…

We do not view Sansera as an auto-component company. We view it as a specialized precision engineering platform that happens to serve the auto industry today but will serve the world’s most critical high-tech industries tomorrow.

1. Financial Transformation (The Return on Capital Story)
The company has invested heavily (~Rs. 1,580 Crores in Capex over 5 years) to build capabilities in Aluminum forging and ADS. These investments are currently depressing return ratios.

The Vision: As these capacities fill up (operating leverage) and the mix shifts to high-margin ADS products (steady-state margins of 25–30%), we expect Pre-tax ROCE to expand to 20%+ over the next 5 years.

2. Resilience Over Speed
In a world of geopolitical friction and supply chain weaponization, global giants need partners they can trust with their most critical components. Sansera has never lost a customer in its history. That culture of resilience—prioritizing engineering depth over quick wins—is what builds the Terminal Value we are betting on.


Final Verdict
We are witnessing a structural metamorphosis. Sansera is evolving from a vendor of engine parts into a strategic partner for the machines that move the world—be it EVs on the road, aircraft in the sky, or the chips powering our future.

The best is yet to come…

From Ancillary to Architect: The Structural Metamorphosis of Craftsman Automation

The Art of Seeing Behind Numbers: Decoding the Engineering DNA

Our journey with Craftsman Automation highlights a structural arbitrage often missed by the market. In March 2022, Craftsman Automation was pegged as a cyclical “CV proxy.” Today, it has emerged as a diversified “Industrial LEGO” set—a modular engineering platform pivoting from truck engines to hyperscale data centers. This report tracks the architectural shift from a vendor of parts to a provider of solutions, driven by a “compounding engine” of competencies

1. The “Street” Missed the Moat: Beyond the CV Label

The “Then” State (March 2022): The Perception Gap

In 2022, When We Initiated Coverage on Craftsman, the market viewed Craftsman Automation strictly as a beta play on the MHCV cycle. The data supported this view:

  • Concentration Risk: Powertrain contributed 52% of revenue, with 61% dependent on MHCVs.
  • Minor Aluminum Presence: Aluminum contributed just 21% of revenue with a capacity of 20,000 TPA, viewed as a junior partner.
  • Valuation Ceiling: Rated as a cyclical auto-ancillary tethered to truck capex cycles.

The Hidden Moat: The “Machine-Building” DNA

The true moat was invisible to the street: Process Engineering. Craftsman Automation doesn’t just run machines; it builds them. Its in-house Special Purpose Machine (SPM) division constructs equipment at a fraction of the cost of imported alternatives.

  • Capital Efficiency: Lower capex equals higher Asset Turnover and ROCE.
  • Agility: Rapid line reconfiguration allows Craftsman Automation to bid for complex jobs competitors find unviable. This “Process Moat” is the engine behind the massive capacity expansion discussed below.

2. The Aluminum Pivot: From Ancillary to Architect

The Strategic Imperative: Escaping the CV Cycle

To decouple from CV volatility, Craftsman Automation executed an aggressive expansion in Aluminum. Capacity exploded 9x in 7 years (11,000 TPA in FY18 to 100,000+ TPA in FY26) via organic growth and M&A.

The “Then vs. Now” Snapshot: Aluminum Segment

MetricThen (Mar 2022 / FY22)Now (FY25/26)The Pivot
Capacity20,000 TPA~100,000 TPA5x Growth from FY22 levels.
Revenue Mix21% of Consolidated Sales53% of Consolidated SalesNow the dominant revenue engine.
EBIT Contribution~1% of Total EBIT (FY21)54% of Total EBITPrimary profit driver.
Key Segments90% Two-WheelersBalanced: PVs, 2Ws, StructuralMassive entry into PVs via DR Axion.

The Three Execution Pillars

  1. DR Axion (PV Entry): Acquired to crack the Passenger Vehicle code. Brought relationships with Hyundai/Kia/Mahindra and critical LPDC/GDC technology, creating a full-spectrum casting suite.
  2. Sunbeam (Turnaround Play): Acquired distressed asset Sunbeam (SLS). Through 50% headcount reduction and plant consolidation, Craftsman is driving margins from negative (65%) in FY24 to a target of 10% (FY26) at Sunbeam
  3. Alloy Wheels (Import Substitution): Greenfield plants in Bhiwadi and Hosur targeting Rs. 800 Crores revenue and 19% market share by FY27, leveraging the “China+1” shift.

3. The Powertrain Evolution: From Wheels to Watts

Reframing the “Sunset” Industry

While cars electrify, critical infrastructure relies on high-performance ICE. Craftsman Automation pivoted its Powertrain segment to target the Data Center Boom.

The Data Center Thesis: A $100 Million Opportunity

Hyperscale data centers require massive V12/V16/V20 backup generators.

  • Fronberg Catalyst: Craftsman Automation acquired Fronberg (Germany) for its deep metallurgical expertise in large-engine casting.
  • The Synergy: Combines German know-how with Indian cost structures (Kothavadi foundry).
  • Visibility: Secured orders from 5 of the top 10 global majors. Targeting $100 million (Rs. 830 Cr) annual revenue from stationary engines by FY29.

The “Then vs. Now” Snapshot: Powertrain Segment

MetricThen (Mar 2022 / FY22)Now (FY25/26 Estimates)The Pivot
Primary DriverDomestic MHCV UpcycleGlobal Off-Highway & Data CentersFrom cyclical domestic to structural global.
Revenue PotentialDependent on Auto Vol$100M/year from Stationary EnginesNew revenue stream by FY29.

4. Industrial & Engineering: The Tech Play

From Racking to Automation

Craftsman Automation shifted from commodity racking to Automated Storage and Retrieval Systems (ASRS).

  • Market Position: Now the #1 player in India’s nascent ASRS market.
  • Strategy: Selling full ecosystems (hardware + software) rather than just steel.
  • Financial Impact: This shift to high-margin automation is driving a projected 50% CAGR in EBIT for the segment (FY25-28E).

5. The Financial Architecture: Data-Backed Transformation

The financials reflect a company exiting a heavy investment phase (“J-Curve”) and entering a harvest phase.

The Financial Journey: Estimates & Projections

MetricFY22 (Actual)FY26E (Est)FY28E (Est)The Trajectory
Revenue  2,217 Cr  7,870 Cr  8,882 Cr 37% CAGR(FY22-26E)
EBITDA  534 Cr  1,178 Cr  1,513 Cr20% CAGR (FY22-26E)
EBITDA %24.1%14.9%17.0%Margin temporarily impacted by acquisitions of Sunbeam and Fronberg, recovery post-acquisitions by FY28e
PAT  163 Cr  352 Cr  632 Cr21% CAGR (EPS Growth).

Key Takeaways:

  1. Hyper-Growth Phase (The Top-Line Story)
    Forget standard industrial growth rates. Craftsman is delivering a massive 37% Revenue CAGR (FY22-26E), essentially nearly 4x its size in just four years (Rs.2,217 Cr to Rs. 7,870 Cr). This aggressive scaling indicates robust market share gains and successful execution of its expansion strategy.
  2. The “Smart” Margin Dip (Strategic Acquisitions)
    The margin contraction in FY25/26 (to ~14.9%) isn’t a red flag—it’s the “investment price” for acquiring Sunbeam and Fronberg. These strategic buys are currently being integrated, and while they weigh on margins temporarily, they are adding critical capacity and capabilities that will serve as the engine for the next leg of growth.
  3. Operating Leverage Kicks in (The Profit Pivot)
    The real bullish story begins post-FY26. As the acquisitions stabilize, we see a massive efficiency payoff. By FY28E, EBITDA margins are projected to bounce back to 17.0%. More importantly, this margin expansion drives non-linear profit growth: PAT is set to nearly double again from FY26 to FY28 (Rs. 352 Cr to Rs. 632 Cr), signaling strong operating leverage.
  4. Rapid Deleveraging (Balance Sheet Strength)
    Despite peak investments in FY25 pushing Net Debt/EBITDA to ~2.7x, the company is projected to generate sufficient cash flow to deleverage swiftly, crashing back to a comfortable 1.0x by FY28E. This rapid cleanup proves the acquisitions are accretive and the business model remains cash-rich.

6. Final Thought: The Art of Seeing Behind Numbers

Craftsman Automation has successfully shed its skin as a CV-dependent machinist.

  • Arbitrage the Time Horizon: The market fears the quarterly “FY25 dip”; the alpha lies in the “FY28 harvest.”
  • Capability Trumps Category: CAL is not an auto ancillary; it is a High-Precision Engineering Architect capable of pivoting from trucks to data centers.
  • Terminal Value: Conviction comes from valuing CAL’s entrenched future in secular trends: Lightweighting, Digital Infrastructure, and Automated Logistics.

Bottomline: The moat is visible. The pivot is complete. The flight continues.