Why India?
Set to enter a multi-year growth cycle
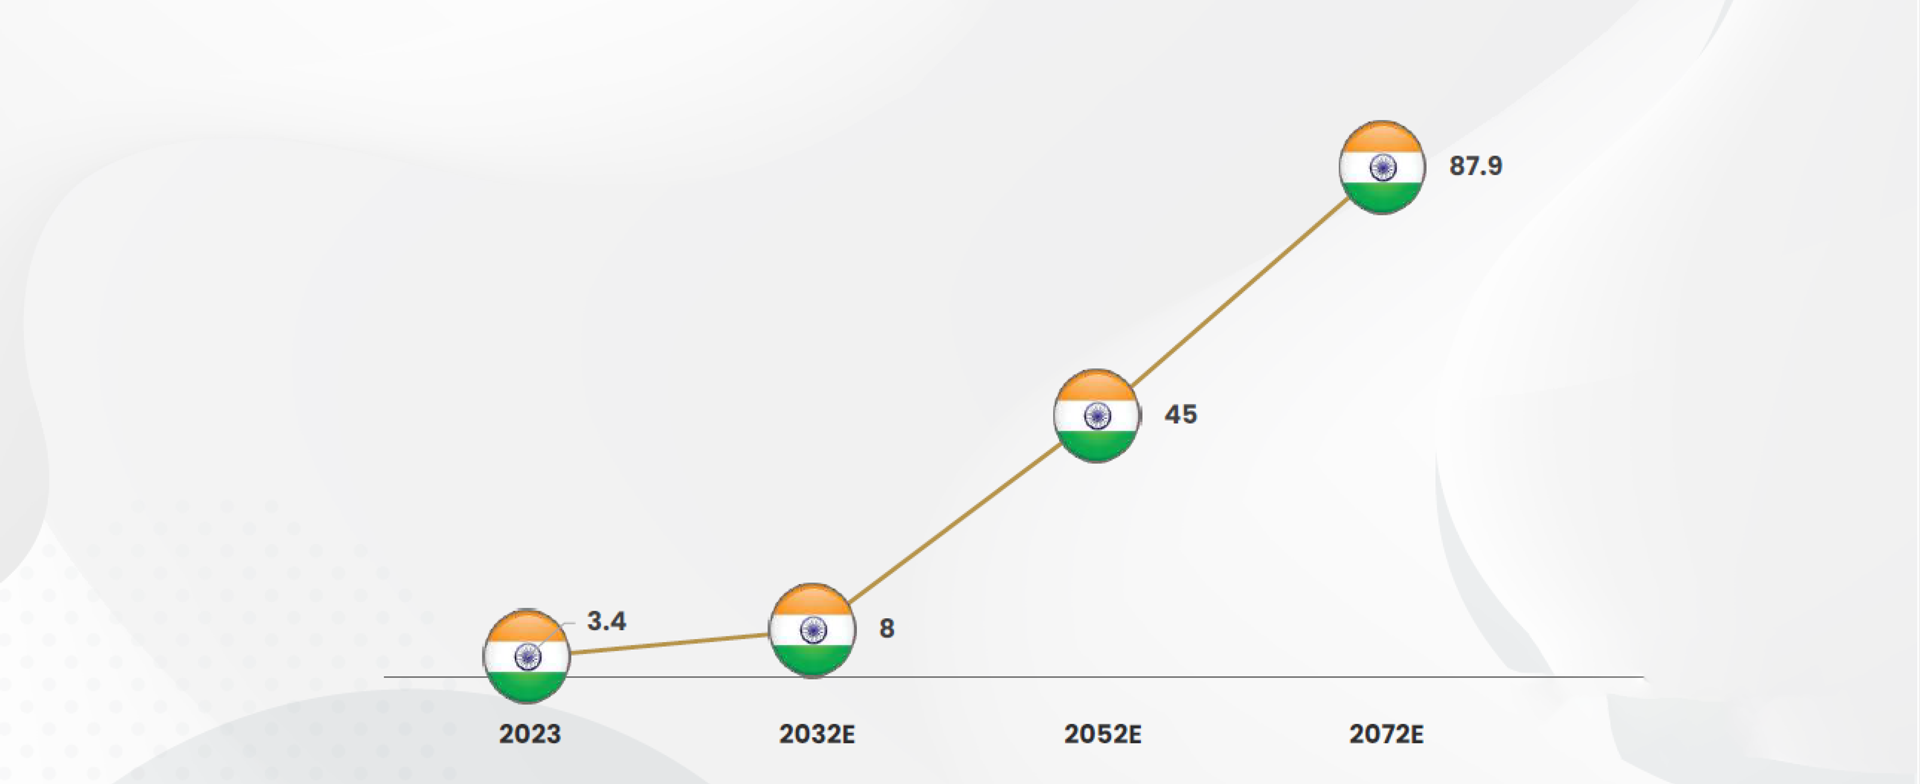
India GDP Growth Trajectory ($ Tn)
- A Visible Snapshot 2023
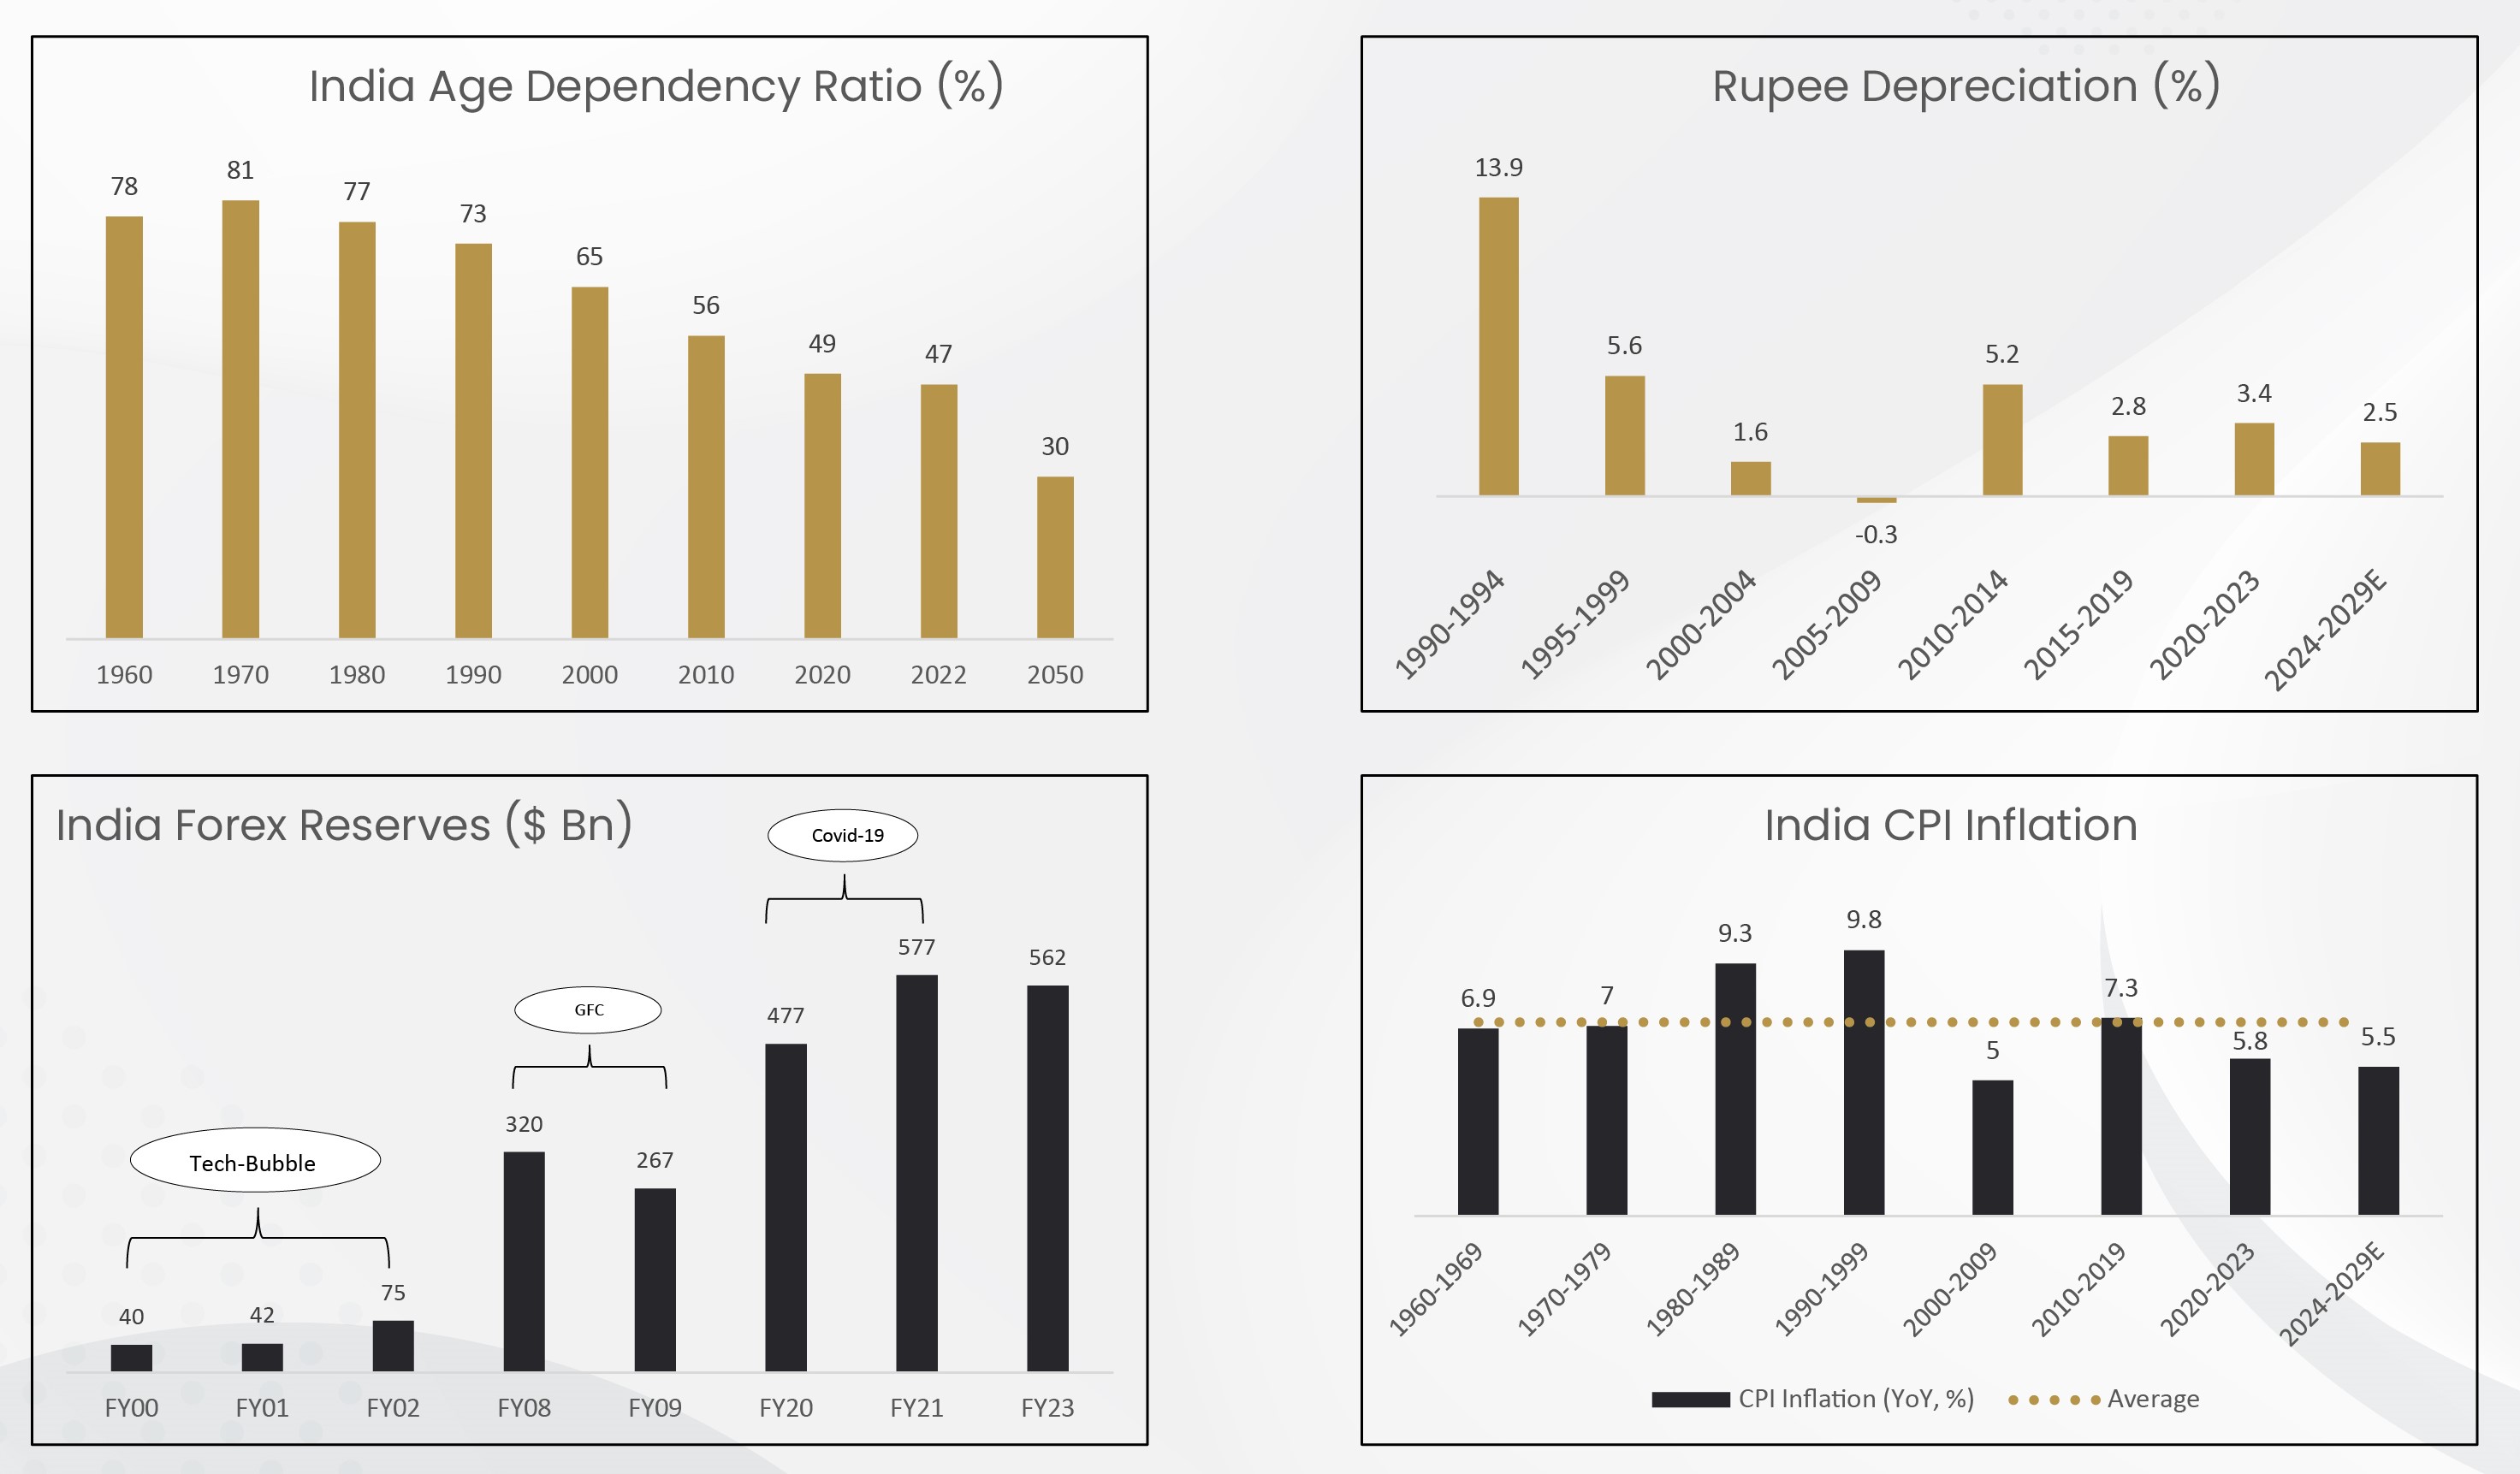
- Why India? Improving Macros
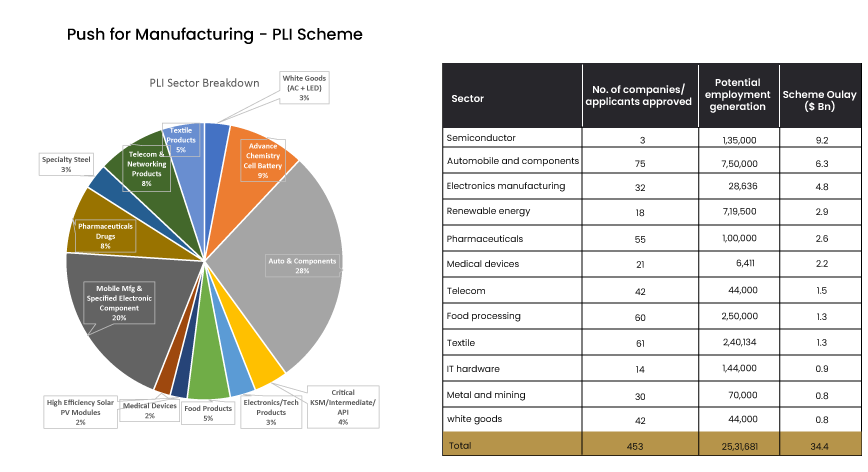
- Push For Manufacturing - PLI Scheme
- Biggest Change In India
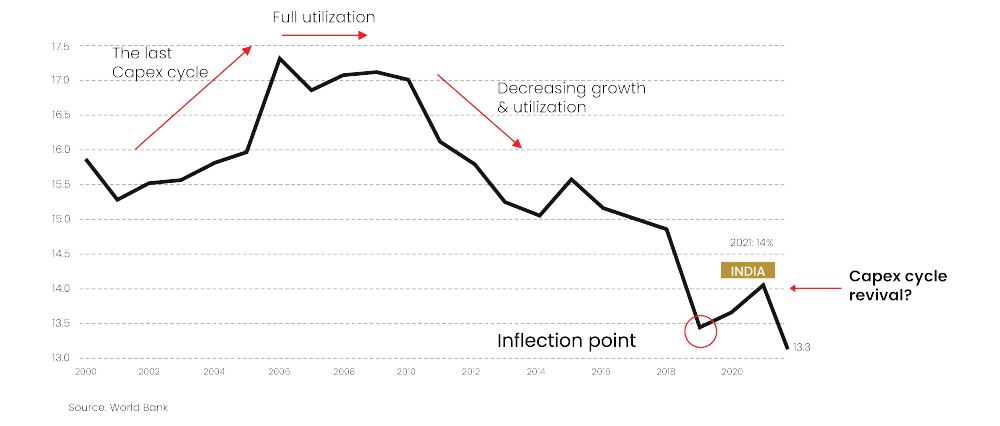
- India's Manufacturing: At an Inflection Point
A Visible Snapshot 2023
| Population | 144 crores |
| Aadhar Card Holders | 136 crores |
| Internet Users | 120 crores |
| Mobile Subscribers | 114 crores |
| Total Enrolled Voters | 95 crores |
| E-commerce Users | 80 crores |
| Smartphone Users | 65 crores |
| OTT Subscribers | 50 crores |
| Social Media Users | 40 crores |
| UPI Users | 30 crores |
| Food Delivery platform Users | 28 crores |
| BHIM Payment Users | 20 crores |
| Urban/ Rural Population (%) | 37/36 |
| Digital Learning Users | 9.3 crores |
| E-Sanjeevani Healthcare Users | 9.2 crores |
| Health Insurance Users | 51.4 crores |
| Stock Fund Investors | 8 crores |
| Mutual Fund Investors | 3.5 crores |
SOURCE - RBI REPORT/ MONEYCONTROL OPEN GOVERNMENT DATA (OGD) PLATFORM INDIA
Why India? Improving Macros
Push For Manufacturing - Pli Scheme
Biggest Change In India
| (INR Cr) | Gross Tax Revenue | Direct Taxes (INR Cr) | Indirect Taxes (INR Cr) | Fiscal Deficit (INR Cr) | FD/GDP |
|---|---|---|---|---|---|
| FY15 | 1,243,799 | 694,658 | 549,141 | 510,817 | 4.1 |
| FY16 | 1,454,568 | 740,865 | 713,703 | 532,791 | 3.9 |
| FY17 | 1,715,637 | 849,528 | 866,109 | 535,618 | 3.6 |
| FY18 | 1,918,946 | 1,001,974 | 916,972 | 591,062 | 3.5 |
| FY19 | 2,080,456 | 1,136,575 | 943,851 | 649,458 | 3.4 |
| FY20 | 2,010,042 | 1,049,530 | 960,512 | 933,668 | 4.6 |
| FY21 | 2,021,281 | 944,874 | 1,082,227 | 1,818,290 | 9.2 |
| FY22 | 2,709,302 | 1,408,280 | 1,301,022 | 1,584,521 | 6.7 |
| FY23(RE) | 3,035,067 | 1,650,000 | 1,384,000 | 1,755,319 | 6.4 |
| FY24(BE) | 3,360,858 | 1,823,250 | 1,537,608 | 1,786,816 | 5.9 |
India's Manufacturing: At An Inflection Point